The What-if add-on for Retire Plan

Change one thing in your plan and see what it does to every year, every chart and your success rate.

What-if add-on $10, or the Full bundle for $25. Each is a one-time purchase.

Try it in the demo No account needed.

Some examples of what you can explore

These are real runs on a sample plan. On your plan you can change any number you like.

Each chart is the Compare view in Retire Plan: the sample plan as it is, and the same plan with one thing changed. The cards show its balance over time, the difference year by year and the side-by-side table.

Market history

A bad market in the first years of retirement

What if the lost decade starts the year you retire?

Balance over time for both plans. The two plans match until 60. From 60 the what-if's median, with 2000 to 2009 replayed, falls away from the dashed median of the plan as it is and stays below it to the end. Balance over time for both plans. The two plans match until 60. From 60 the what-if's median, with 2000 to 2009 replayed, falls away from the dashed median of the plan as it is and stays below it to the end.
Your plan
100%
What-if
75%

success rate, the share of cases since 1871 that never ran out

Stocks lost 3.0% a year after inflation from 2000 to 2009. 25% of the cases fail, and the median case ends the plan with $1.45M instead of $2.31M.

2000 to 2009 replayed from 60, in every case. Sample plan: age 40, retiring at 60 on $50,000 a year.

What if high inflation arrives the year you retire?

Balance over time for both plans. From 60, with 1973 to 1982 replayed, the what-if's median drops fast and keeps sliding toward zero, while the dashed median of the plan as it is keeps growing. Balance over time for both plans. From 60, with 1973 to 1982 replayed, the what-if's median drops fast and keeps sliding toward zero, while the dashed median of the plan as it is keeps growing.
Your plan
100%
What-if
64%

success rate, the share of cases since 1871 that never ran out

Prices rose 8.7% a year, and the spending rose with them. 36% of the cases fail.

1973 to 1982 replayed from 60, in every case. Sample plan: age 40, retiring at 60 on $50,000 a year.

What if 2008 happens the year you retire?

Balance over time for both plans. With 2008 to 2009 replayed from 60, the what-if's median dips below the dashed median of the plan as it is, then runs close under it for the rest of the plan. Balance over time for both plans. With 2008 to 2009 replayed from 60, the what-if's median dips below the dashed median of the plan as it is, then runs close under it for the rest of the plan.
Your plan
100%
What-if
97%

success rate, the share of cases since 1871 that never ran out

Stocks lost 8.6% a year after inflation over those years. 3% of the cases fail, and the median case ends the plan with $1.68M.

2008 to 2009 replayed from 60, in every case. Sample plan: age 40, retiring at 60 on $50,000 a year.

Changes at work

Less pay for a while

What if you go a year without pay at 45?

The difference, year by year: what the what-if has minus what the plan has in each case, from age 40 to the end of the plan. The median line sits at zero until 45, drops below zero at 46 and stays there, $46K behind at 60 and $206K behind at the end. The difference, year by year: what the what-if has minus what the plan has in each case, from age 40 to the end of the plan. The median line sits at zero until 45, drops below zero at 46 and stays there, $46K behind at 60 and $206K behind at the end.
Your plan
$1.06M
What-if
$1.02M

saved by 60 on the expected path

The line drops below zero at 46 and stays there. The what-if is behind by a median of $46K at 60 and $206K at the end. The success rate stays at 100%.

No pay and no saving from 45 for a year, then the usual pay again. The plan takes nothing out of savings during the gap; it assumes you get by on other money. Sample plan: age 40, retiring at 60 on $50,000 a year.

What if you take a job that pays 30% less at 45?

The Compare view's side-by-side table for both plans. The success rate is 100% against 93%, the balance at retirement $1.06M against $970K, and the median ending balance $2.31M against $1.92M. The Compare view's side-by-side table for both plans. The success rate is 100% against 93%, the balance at retirement $1.06M against $970K, and the median ending balance $2.31M against $1.92M.
Your plan
100%
What-if
93%

success rate, the share of cases since 1871 that never ran out

Saving falls with the pay. 7% of the cases fail, and the balance at 60 is $970K instead of $1.06M.

Pay 30% lower from 45 until retiring. Social Security stays as typed in the plan. Sample plan: age 40, retiring at 60 on $50,000 a year.

When and how you retire

Choices you make at the end of work

What if you retire three years earlier?

Balance over time for both plans. The what-if's median stops growing at 57 and stays well under the dashed median of the plan as it is, which keeps growing until 60. Balance over time for both plans. The what-if's median stops growing at 57 and stays well under the dashed median of the plan as it is, which keeps growing until 60.
Your plan
100%
What-if
75%

success rate, the share of cases since 1871 that never ran out

At 57 the plan has $858K saved on the expected path and more years to pay for. 25% of the cases fail.

Retiring at 57 instead of 60, still planned to the same age. Sample plan: age 40, on $50,000 a year.

What if you work part-time for those three years?

Balance over time for both plans, with markers at 57 for part-time work and at 60 for full retirement. The what-if's median levels off at 57 and runs under the dashed median of the plan as it is. Balance over time for both plans, with markers at 57 for part-time work and at 60 for full retirement. The what-if's median levels off at 57 and runs under the dashed median of the plan as it is.
Your plan
100%
What-if
85%

success rate, the share of cases since 1871 that never ran out

Stop full-time work at 57 and earn $29,200 a year part-time until 60. The success rate is 85%. Stopping all work at 57 instead gives 75%.

The part-time pay is Retire Plan's Barista FIRE figure for this spending. Sample plan: age 40, on $50,000 a year.

What if you spend 20% less?

The difference, year by year: what the what-if has minus what the plan has in each case. The median line sits at zero until 60, then climbs every year, because spending $40,000 a year instead of $50,000 leaves more in savings. The difference, year by year: what the what-if has minus what the plan has in each case. The median line sits at zero until 60, then climbs every year, because spending $40,000 a year instead of $50,000 leaves more in savings.
Your plan
$2.31M
What-if
$3.29M

balance at the end of the plan, the median case

On $40,000 a year instead of $50,000, the line sits at zero until 60 and climbs every year after. The median case ends the plan with $973K more. The plan could also retire three years sooner, at 57, and keep a 100% success rate.

Spending 20% less in retirement, still retiring at 60. 57 is the earliest age that keeps a 100% success rate on this spending. Sample plan: age 40.

What if you wait until 70 to claim Social Security?

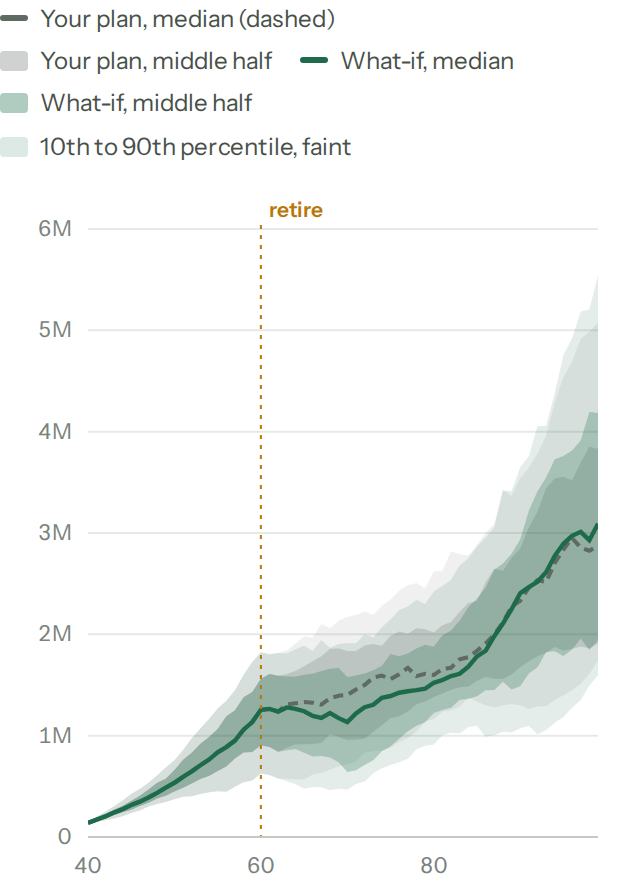
Balance over time, claiming at 62 and at 70. After 60 the median for claiming at 70 runs under the dashed median for claiming at 62 while savings carry the years before 70, then crosses above it at about 90. Balance over time, claiming at 62 and at 70. After 60 the median for claiming at 70 runs under the dashed median for claiming at 62 while savings carry the years before 70, then crosses above it at about 90.
Claiming at 62 is ahead at first. Claiming at 70 pulls ahead late in the plan.
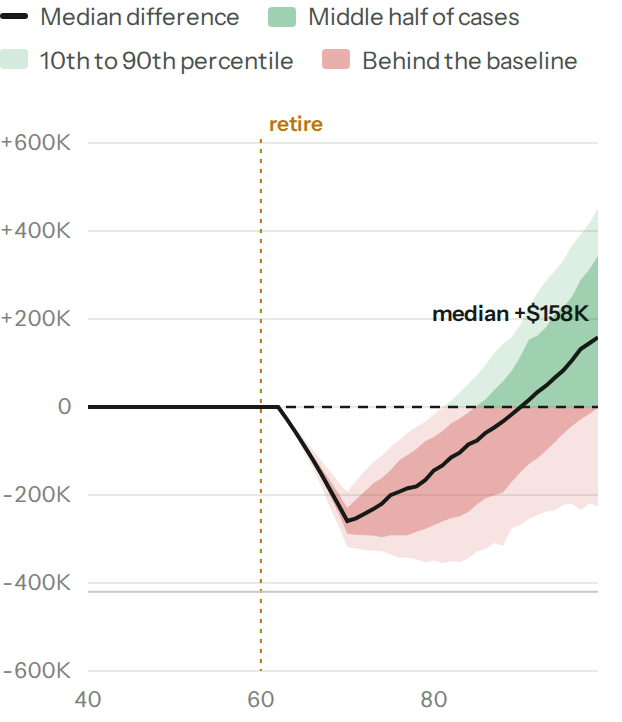
The difference, year by year: what claiming at 70 has minus what claiming at 62 has in each case. The median line sits at zero until 62, drops below zero at 63 while savings carry the years before 70, and comes back above zero at 91. The difference, year by year: what claiming at 70 has minus what claiming at 62 has in each case. The median line sits at zero until 62, drops below zero at 63 while savings carry the years before 70, and comes back above zero at 91.
Below zero from 63: the years before 70 cost savings. Above zero from 91: the bigger benefit has paid them back.
Claim at 62
$2.94M
Claim at 70
$3.16M

balance at the end of the plan, the median case

The benefit is $3,900 a month from 70 instead of $2,202 from 62. Savings carry the years in between, and the success rate stays at 100%.

Social Security estimated from the plan's pay, not typed. Sample plan: age 40, retiring at 60 on $50,000 a year, 100% success rate either way.

Try it on your plan

Each of these takes a few taps in the Compare view. Try them in the demo on a sample plan, with no account. On your own numbers, Compare is included with the What-if add-on. See what it costs.

Open the demo

Create an account