
The PDF report add-on for Retire Plan
Your retirement plan, with every number explained, as a PDF you keep.
- What to save each year, what to take out of each account, and the tax on it, year by year.
- The numbers that move your plan most, worked out for you: how much you could spend and how early you could retire.
- How your plan holds up through a bad market, a year with no pay or retiring early.
- Something to hand to a spouse or an adviser, built from your own numbers.
PDF report add-on $10, or the Full bundle for $25. Each is a one-time purchase.
Try it in the demo No account needed. Open the sample report Download the sample PDF
Pages from the sample
What the pages look like
These pages are from a real report on a sample plan.
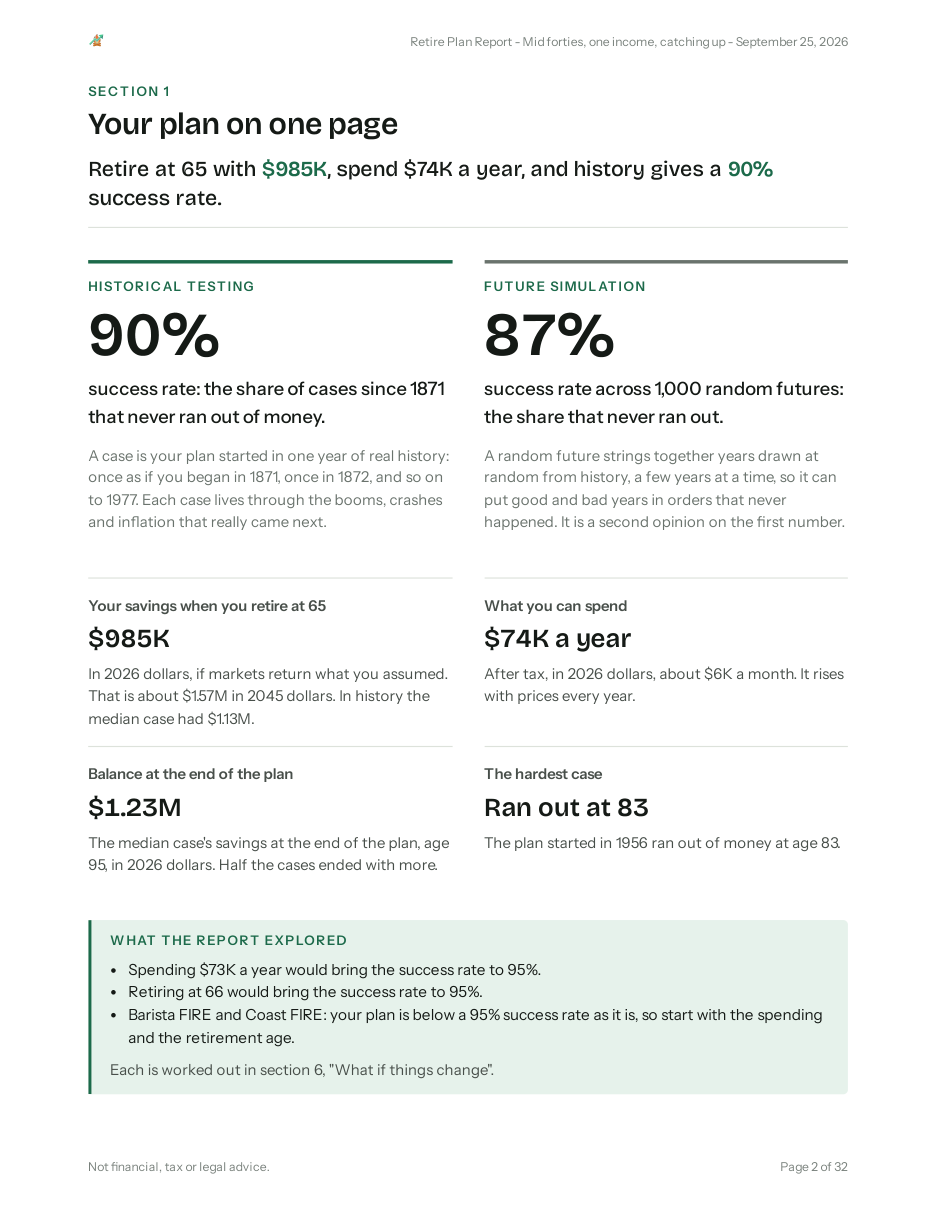
Your plan on one page
The first page is the short version. It gives the success rate from market history and from random futures, and says what each one means.
Below that are four numbers to remember: your savings when you retire, what you can spend each year, the balance at the end of the plan, and how the hardest case in history ended. The box at the bottom says what the report found you could change.
Page from the sample report, "Mid forties, one income, catching up".
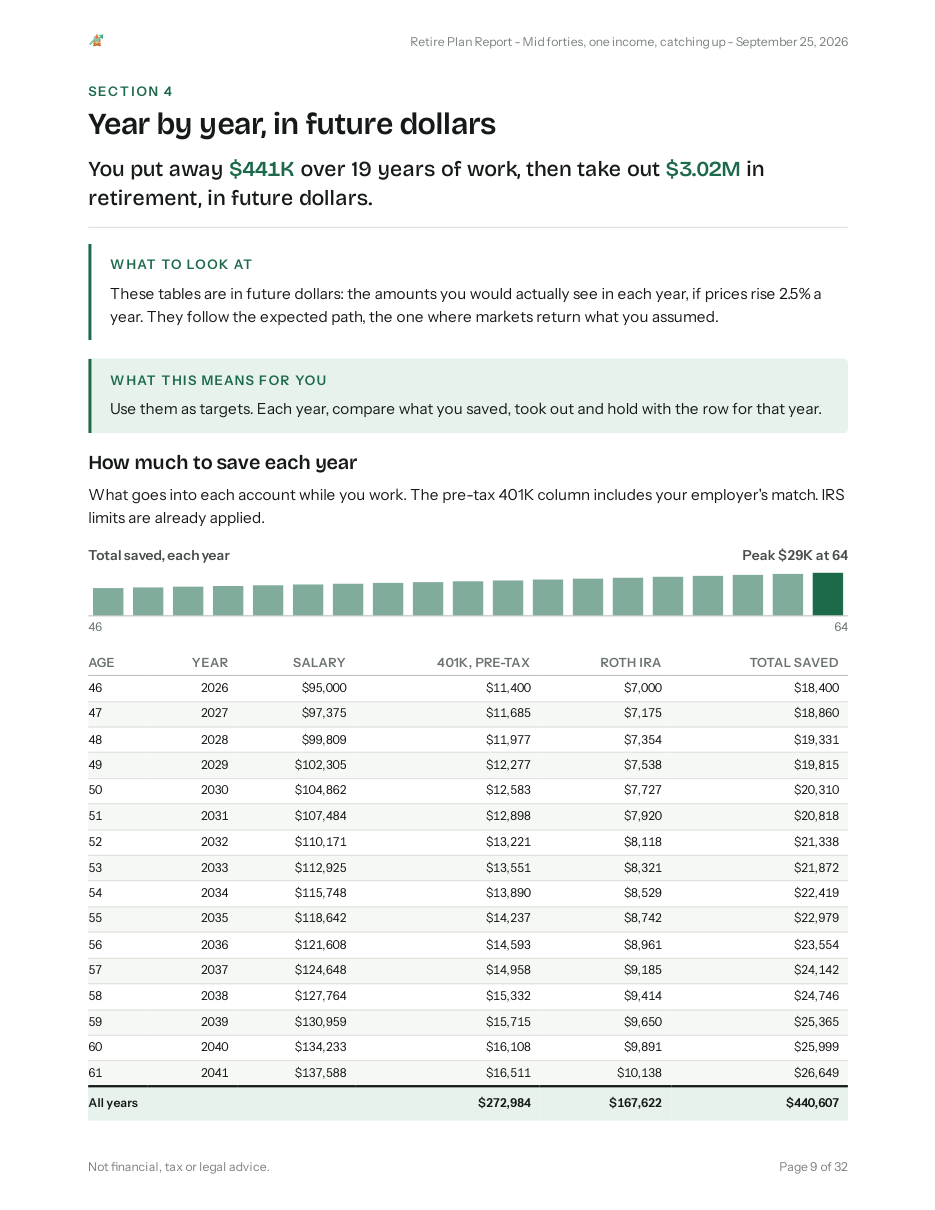
Year by year
How much to put in each account every year, in the dollars you would type into a payroll form. Four more tables follow it: what to take out, the taxes, what you can spend and what each account holds.
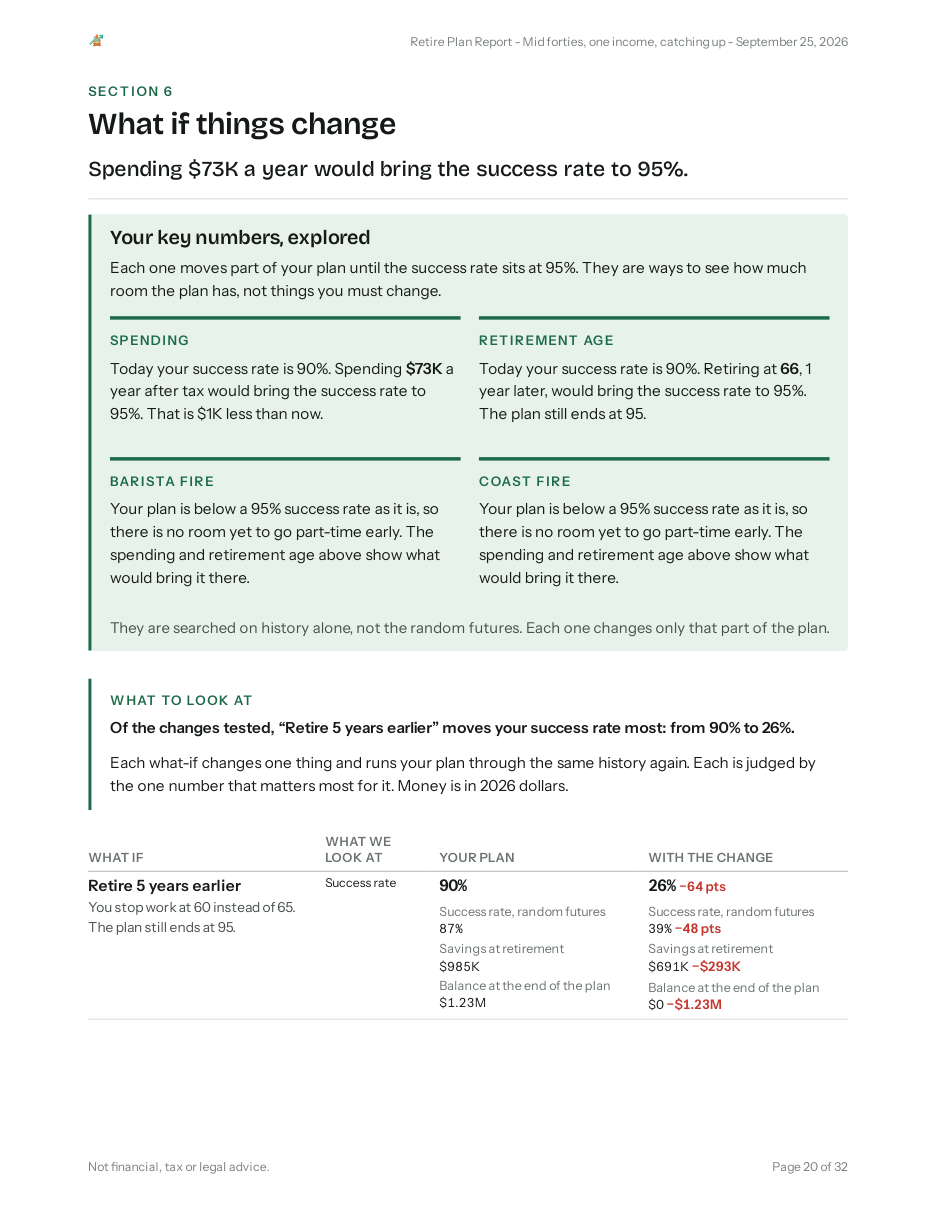
What if things change
Each what-if changes one thing and runs your plan through the same history again. The table shows your plan next to the changed one, on the number that matters most for that change.
Your numbers are worked out in your browser, in about ten seconds. Then our server lays out the pages and hands you the PDF a few seconds later. The file is kept encrypted, like your plans, and goes when you delete it or your account.
The PDF report is a $10 add-on to the planner, a one-time purchase. It costs a little less in a bundle with the What-if tool or with the planner. See every price
What is inside
What is in the report
- Your plan on one page. Your success rate, what you can spend, the balance at the end of the plan and the hardest case.
- Your plan and your assumptions. Every input written out, so you can check what the report was built from.
- Your plan in pictures. Four charts of your savings and your income, each with a note on what to look at.
- Year by year, in future dollars. What to save, what to take from each account, the taxes and what you can spend, for every year.
- What this report leaves out. The things the model does not cover.
- What if things change. Your key numbers explored: how much you could spend, how early you could retire, and when Barista FIRE or Coast FIRE would hold a 95% success rate. Then the what-ifs: retiring five years sooner or later, a bad market, a year with no pay, when to claim Social Security, and a longer or shorter plan.
- Words used in this report. A short glossary, from "case" to "withdrawal rate".
- How the numbers are checked. Where the market data comes from and how the math is tested.
With the What-if add-on, build it while a what-if is open in Compare and it gets one more, right after "What if things change": your own what-if beside your plan, with the table and the charts from Compare.
Try it on your plan
The demo builds the report for a sample plan in your browser, with no account. On your own numbers, the Report is an add-on to the planner, and the PDF is made for you.
Open the demoOpen the sample report Download the sample PDF Create an account