Am I on track to retire?
Most retirement calculators give you one number from one average return. This one runs your plan through every year of market history since 1871, using the real returns and the real inflation of each stretch, and tells you how many of them you would have made it through.
No account. Nothing you type leaves your browser.
Three minutes to a first answer
It starts with your paycheck
The planner opens with a short set of questions. Your age, your state, what is on your paycheck, what you have saved, what you spend. It works out your federal tax, your payroll tax and your state tax from the 2026 tables as you type, so you never have to guess at a tax rate. By the last question it has a number for you: the age you could stop working, and how often a plan like that survived history.
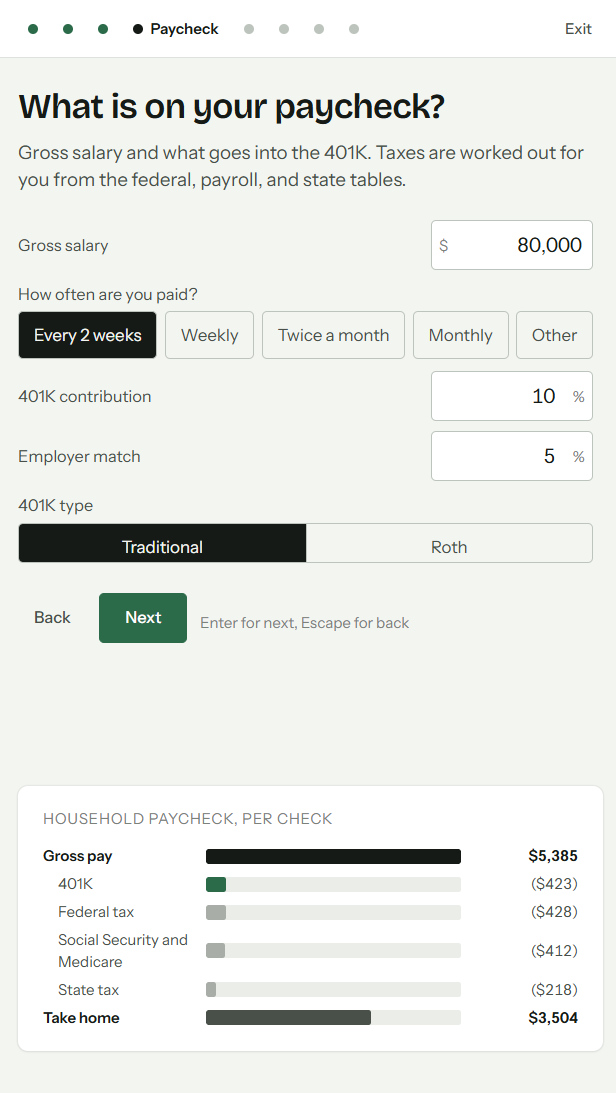
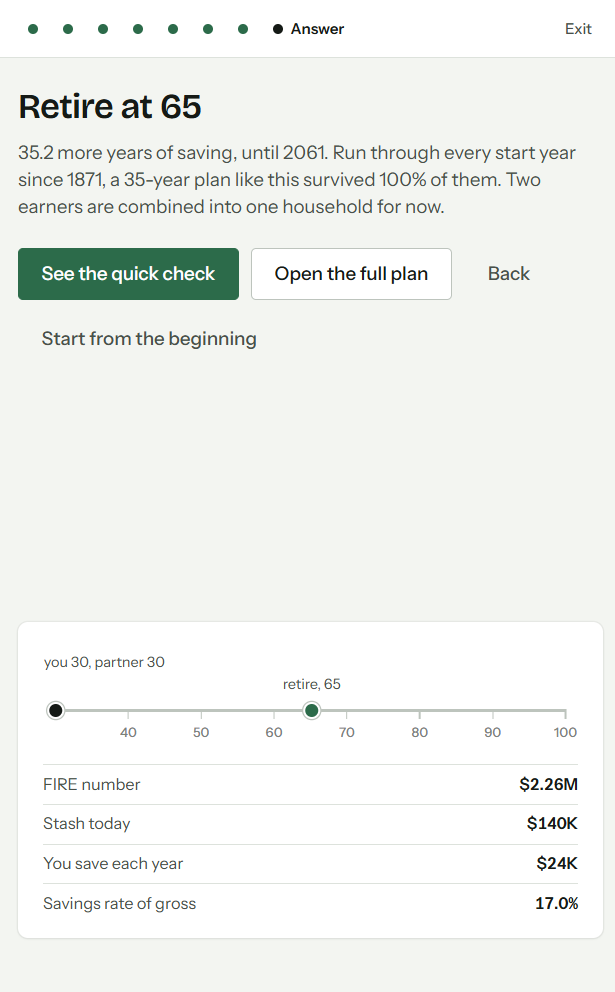
Two incomes are asked for separately, each with its own contribution limit, then combined into one household.
Every answer stays editable. The wizard can be reopened at any point from the plan menu, and skipping a question leaves a sensible default in place.
Backtest
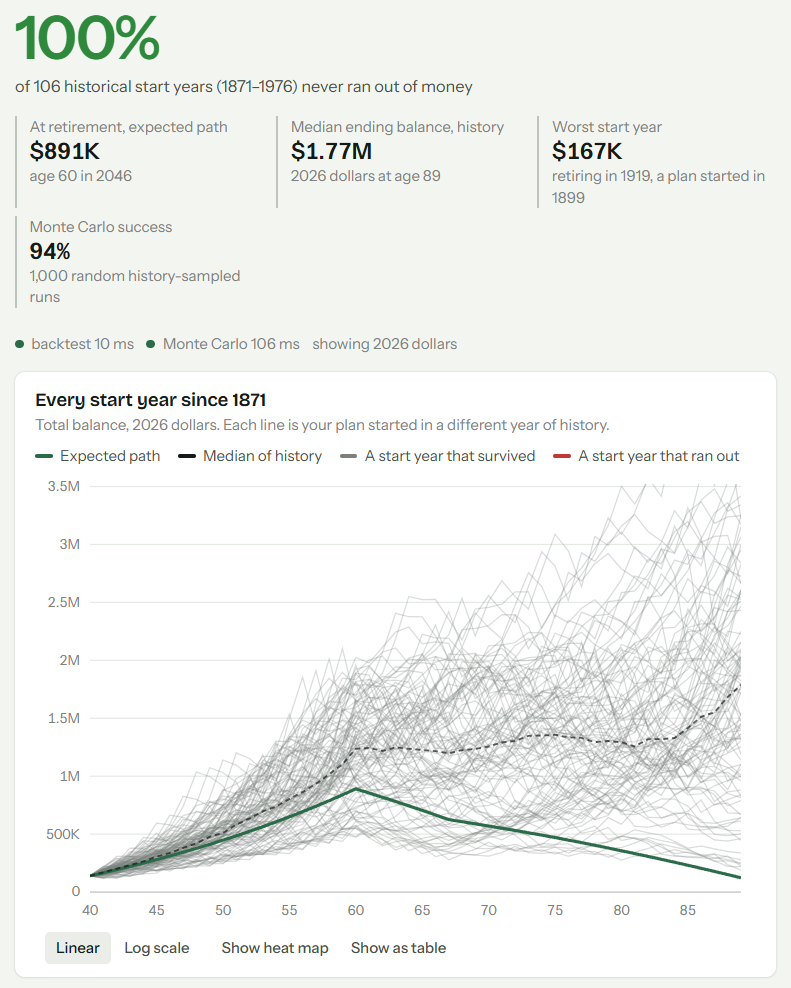
Every start year since 1871
Your plan is run once for a person who started it in 1871, again for 1872, and so on through the last window the data allows. Each run uses that stretch of history exactly as it happened: the 1929 crash, the 1970s inflation, the 1966 retiree who watched a flat market eat a portfolio that looked comfortable on paper.
The headline is the share of those start years that never ran out of money. Below it you can see which ones failed and at what age, and switch the chart between individual paths and a heat map of where the outcomes gathered.
The full plan
Change one input and watch everything move
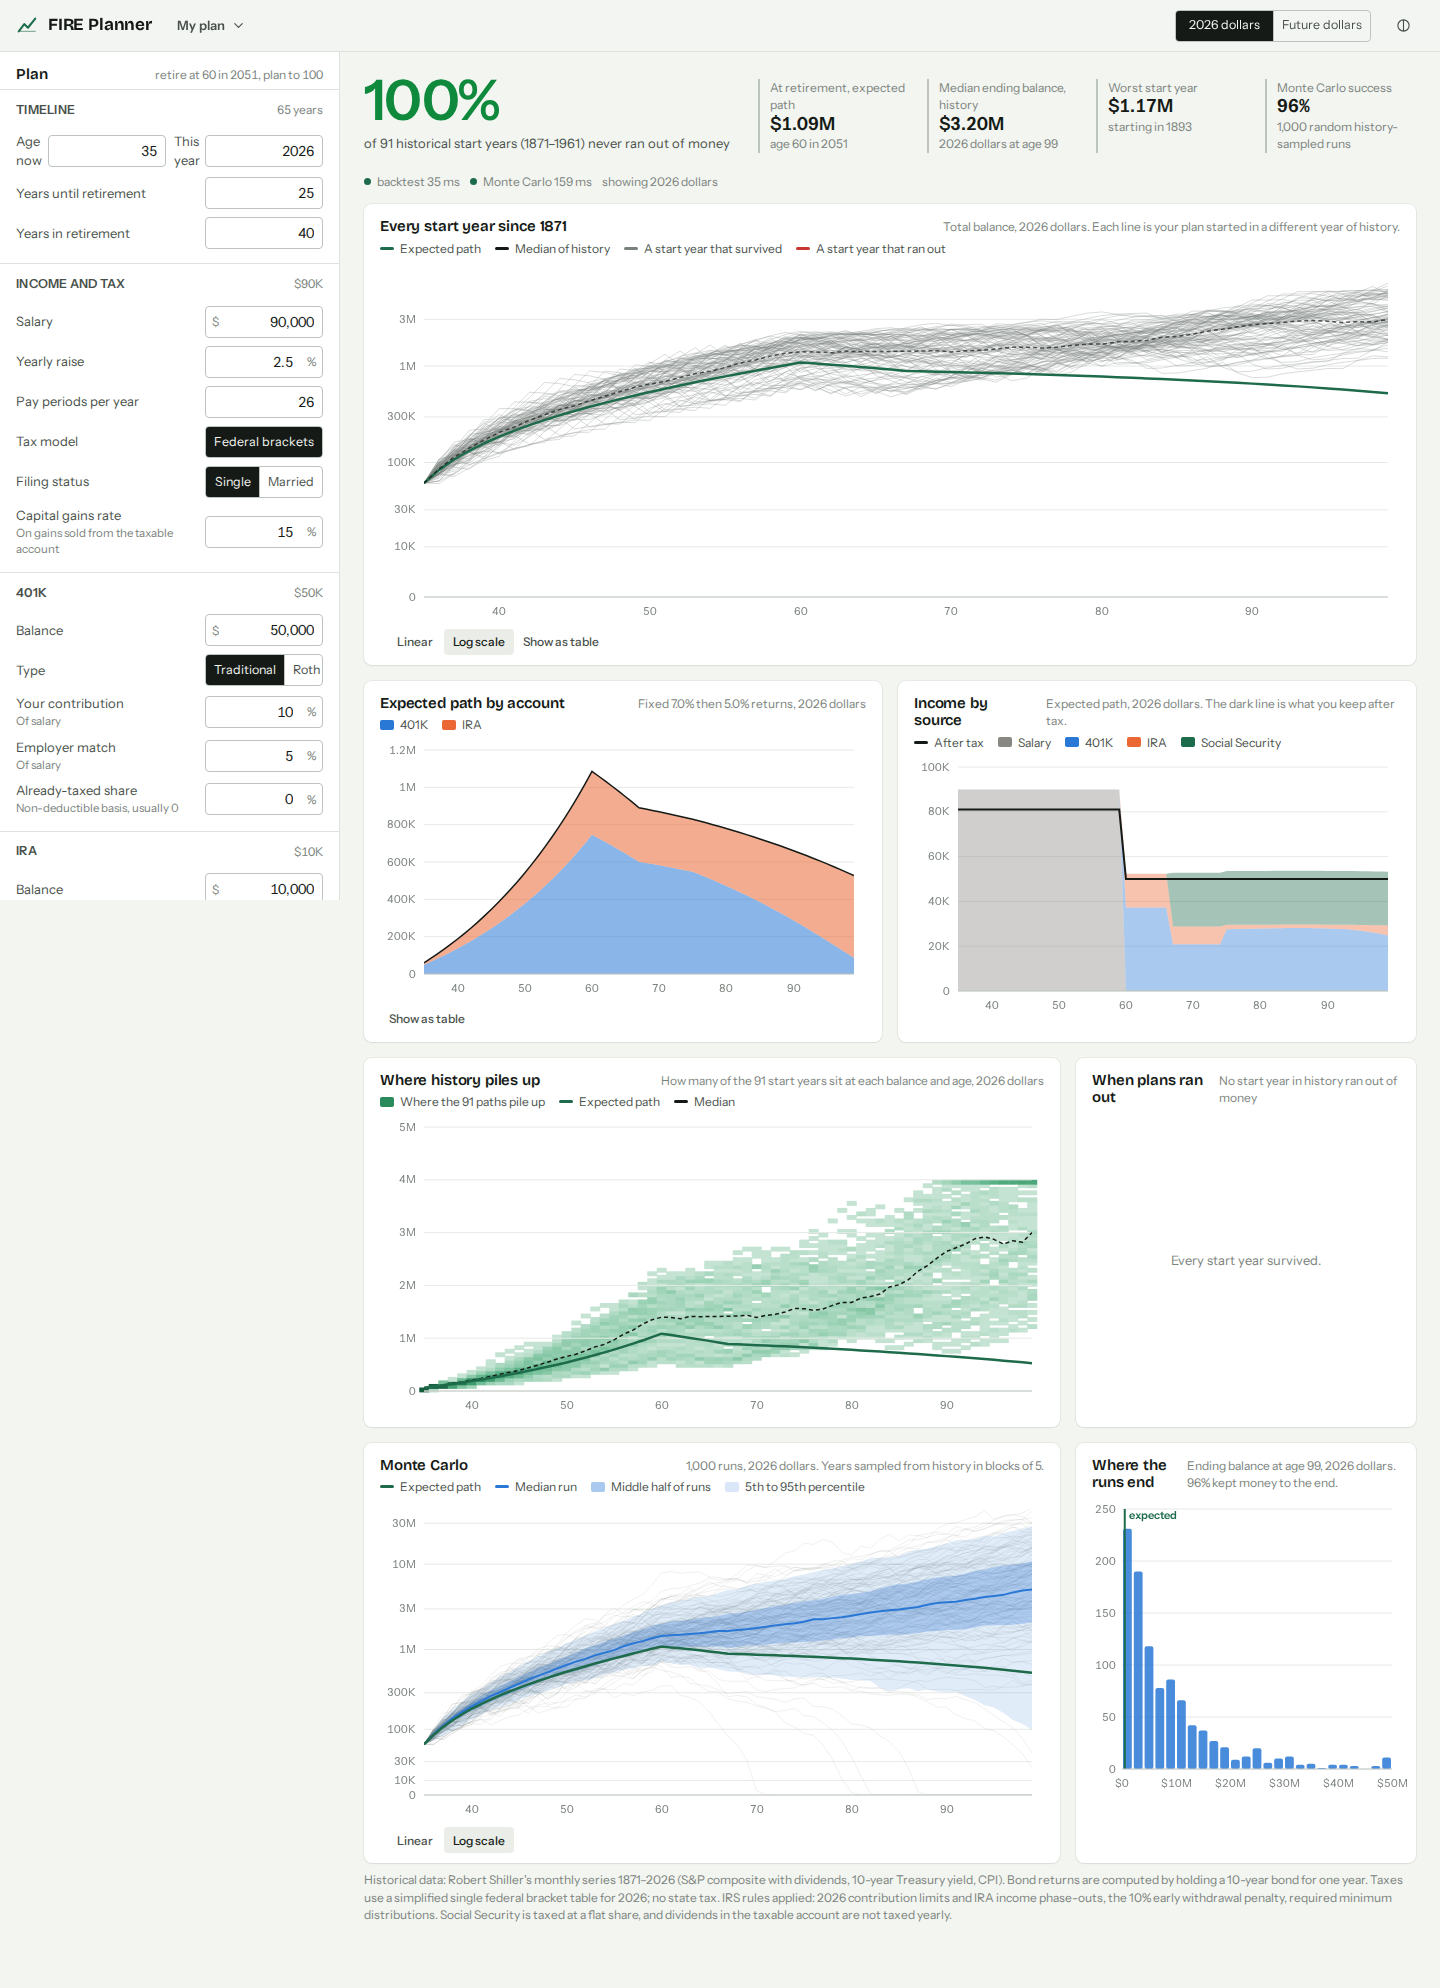
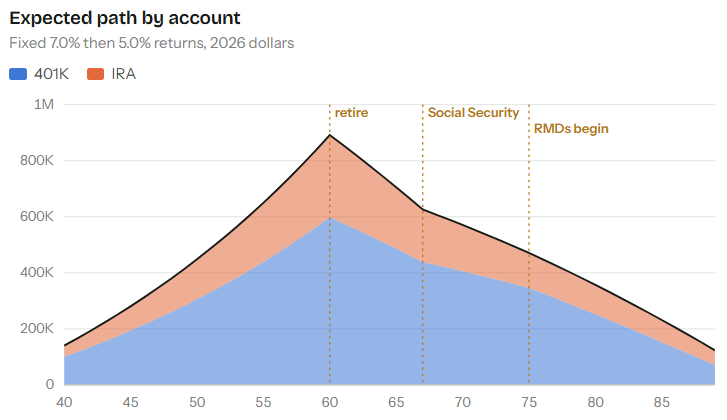
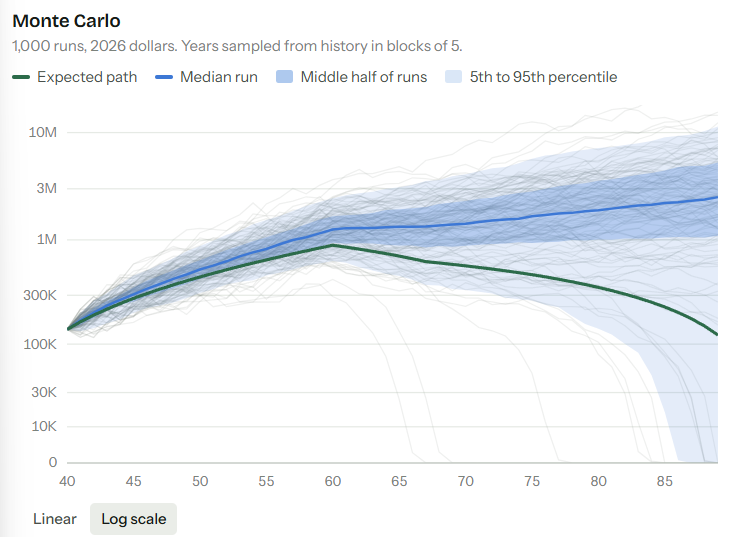
Salary, contributions, employer match, the split between stocks and bonds, the age you claim Social Security, a pension, a taxable brokerage account. Every input recomputes the backtest and a thousand Monte Carlo runs in well under a second, so trying an idea costs nothing.
Taxes and IRS rules
Contribution limits, penalties and required withdrawals
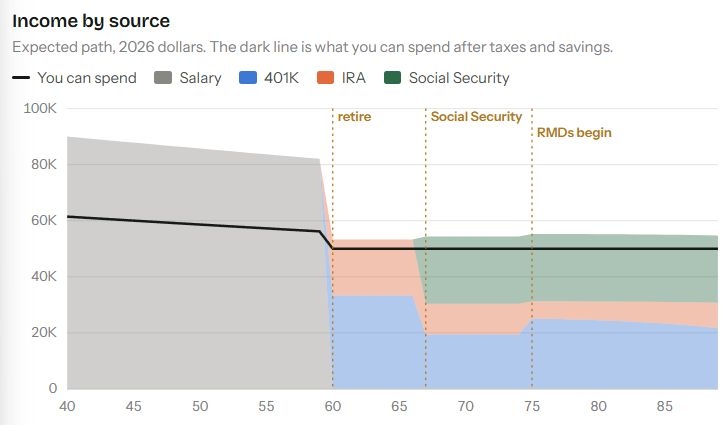
Contribution limits for 2026, with the catch-ups at 50 and at 60. The 10 percent penalty on money drawn before 59 and a half, and the rule of 55 that waives it on a 401K. Required minimum distributions from 73 or 75, using the IRS table, with the part you do not spend saved rather than counted as income you can spend.
State income tax comes from a per-state table, including which states leave Social Security alone and which exempt retirement withdrawals. Each rule has a switch, so you can see what it costs you.
Where the numbers come from
You can check every input to the model
A planner is only worth as much as the data behind it, so here is all of it.
| Stock returns | Robert Shiller’s monthly S&P composite series with dividends, 1871 to 2026, compounded month by month into calendar years. |
|---|---|
| Bond returns | Worked out from the yield curve. A 10-year Treasury is bought at January’s yield and sold a year later as a 9-year bond at the next January’s yield. Many calculators use the yield itself, which understates 1982 by about 15 points. |
| Inflation | Each backtest window uses the CPI recorded for those years, rather than one assumed rate. |
| Tax tables | 2026 federal brackets with the standard deduction, Social Security and Medicare with the $184,500 wage base, and a per-state rate table. |
| Cross-check | Stock and bond series correlate 0.97 and 0.96 with Aswath Damodaran’s independent annual series over 1928 to 2025. |
| Against the literature | A 4 percent withdrawal over 30 years at 75/25 survives 98.6 percent of start years since 1926. The Trinity study reports 98 percent. The worst start year in both is 1966. |
| Not modeled | Healthcare costs, long-term care, the Social Security earnings test, yearly dividend tax in a taxable account, Roth conversions, 72(t) payments, state deductions and partial retirement exclusions. |
Your data
Your salary stays on your machine
There is no account and no server holding your plan. Everything you type is kept in your own browser, and you can export a plan as a file or import one back. Clearing your browser data clears your plan, so export anything you want to keep.
Open it and put your own numbers in
It takes about three minutes, and there is nothing to sign up for.
Open the planner