
Where this came from
In 2014 I wanted to know how long my retirement savings would last if I carried on saving the way I was saving, so I built a worksheet in Excel to work it out. It was for me. When it was finished I posted it to r/personalfinance in case anyone else had the same question, and I spent a long time afterwards answering people in the comments.
Then I hit the edges of what a spreadsheet does well. I wanted sliders I could drag and charts that redrew while I dragged them, and I wanted to run the same plan against more than one stretch of market history at a time. So I rebuilt it as a desktop app in MATLAB. That version I never shared. It sat on my laptop and I opened it whenever I changed jobs or changed my mind about something.
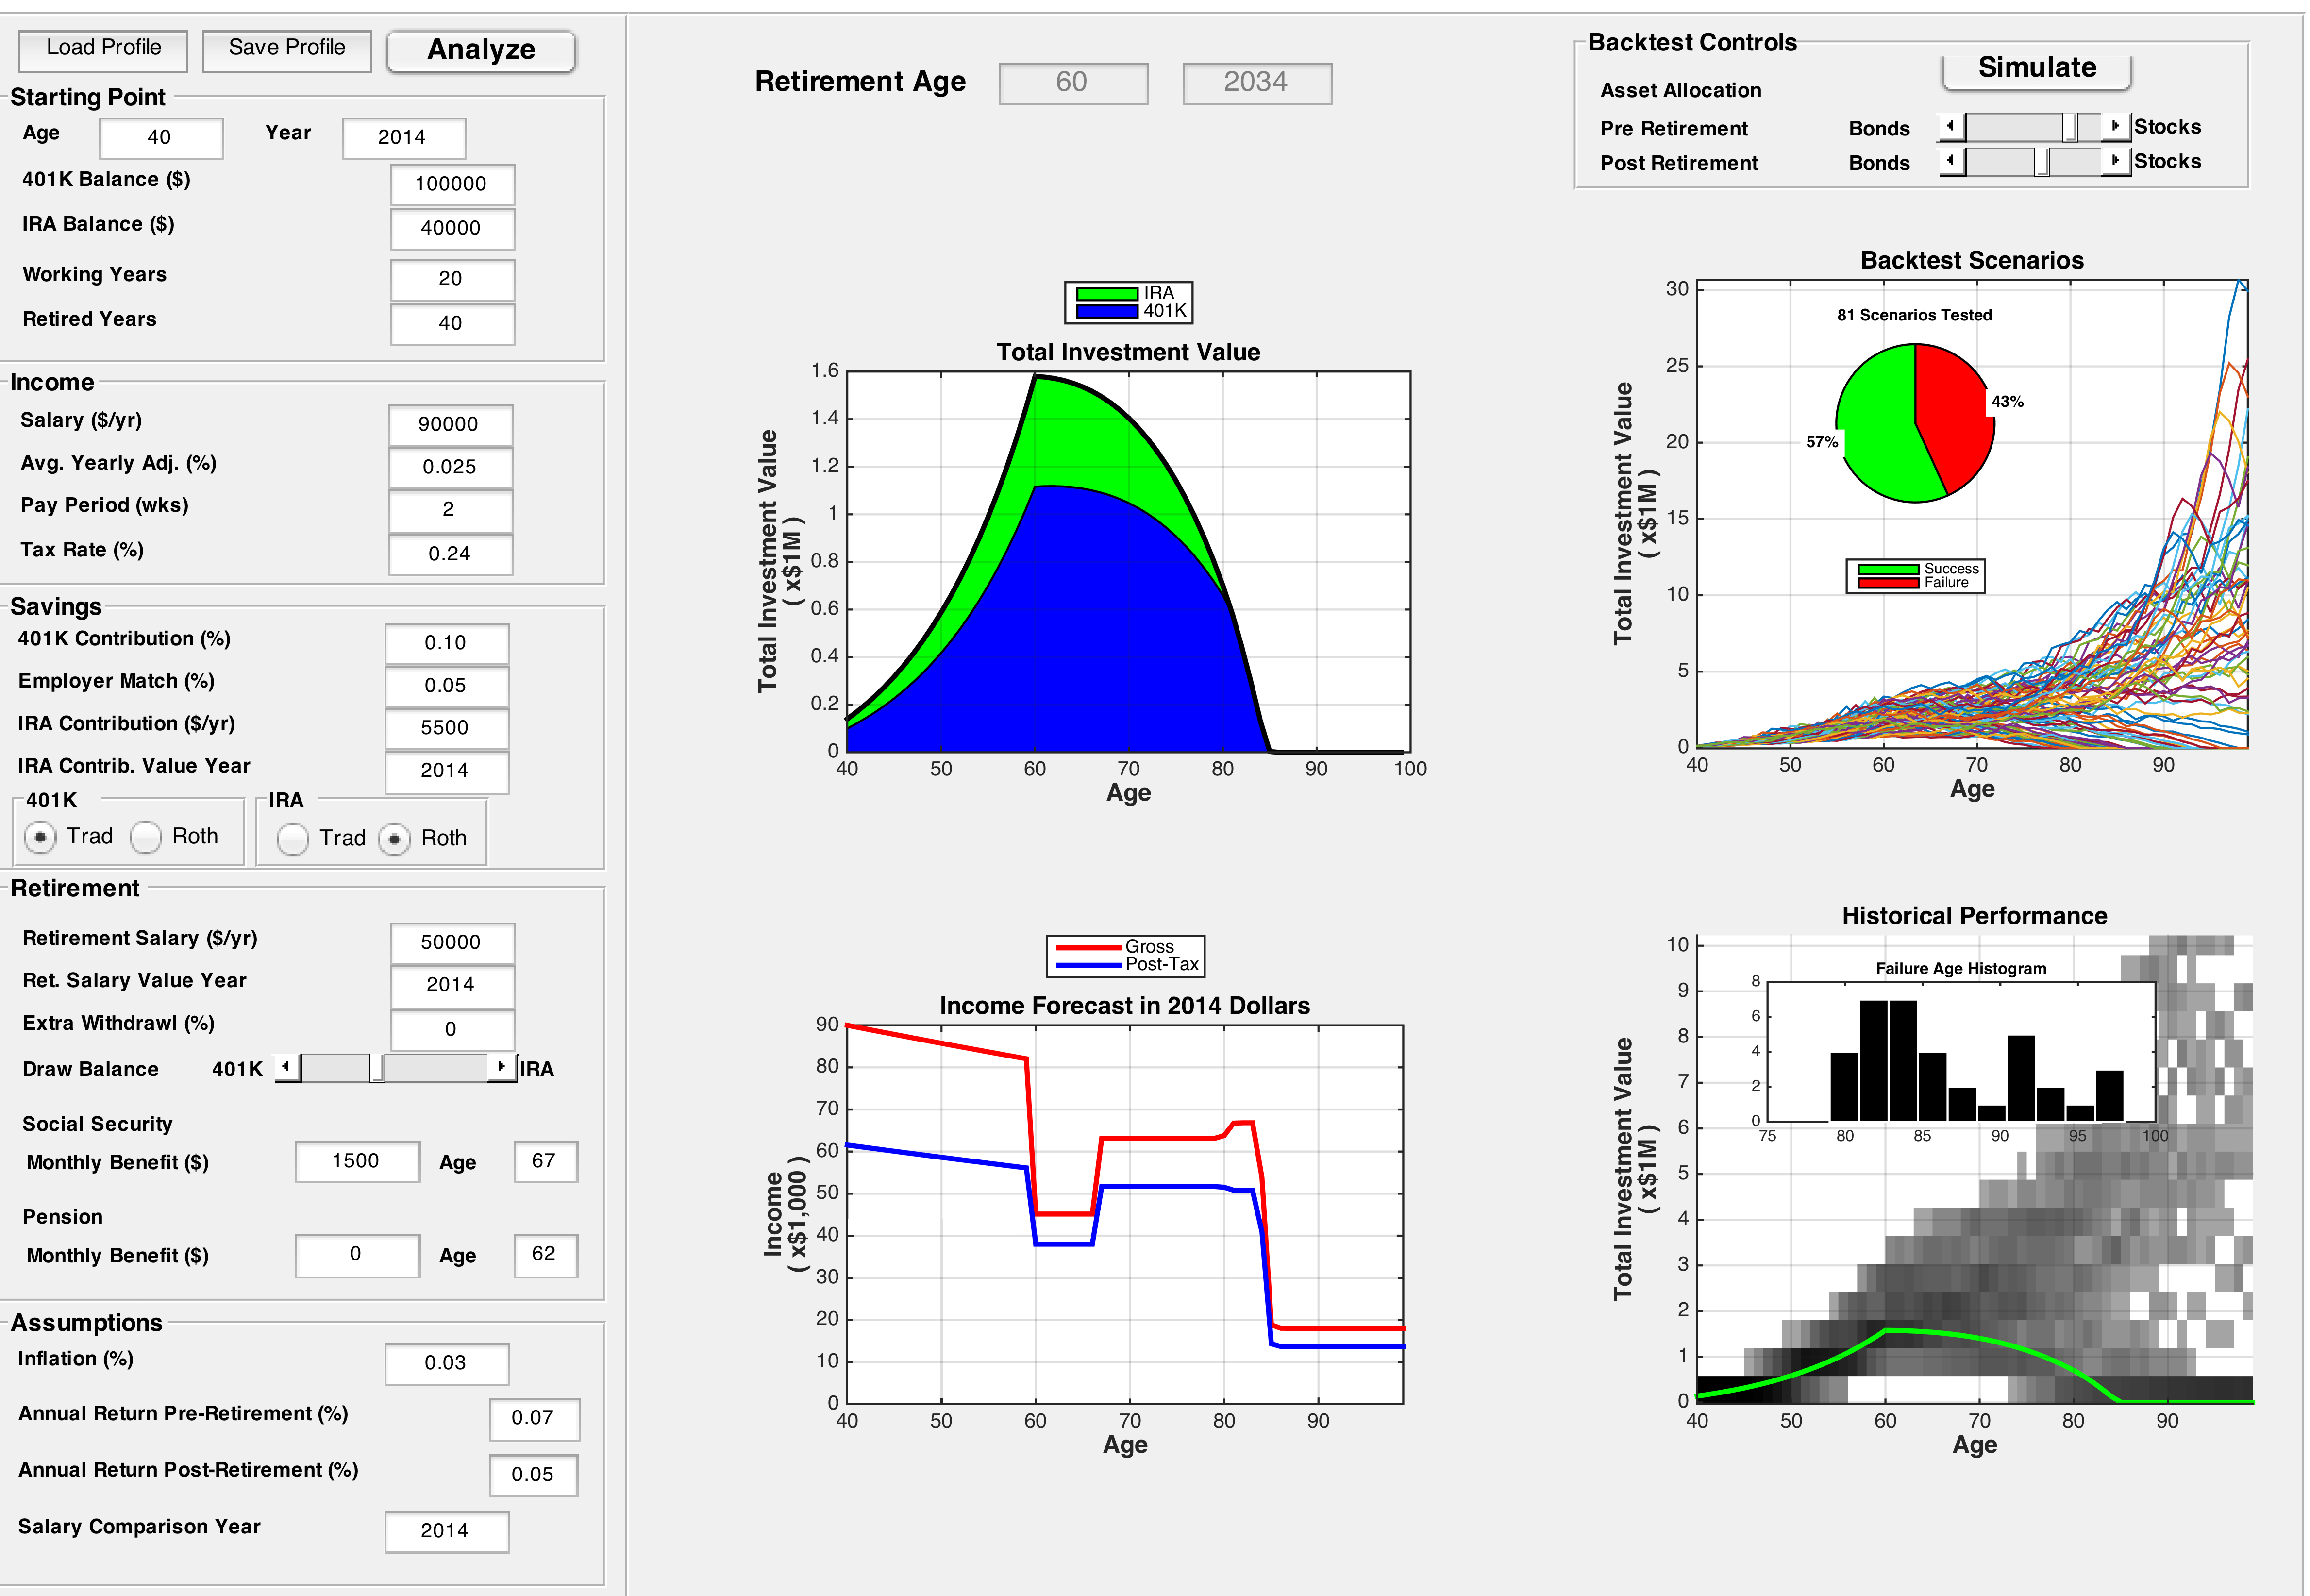
You typed in your age, your 401K and IRA balances, your salary, what you put in and what your employer matched, and whether each account was traditional or Roth. Social Security and a pension had their own boxes. Two sliders set the stock and bond mix, one for the years before retirement and one for the years after. It drew the total value of the accounts, an income forecast in 2014 dollars, and a backtest of 81 cases with a histogram of the ages at which the money ran out.
Tax was one number you typed in yourself. I knew that was rough and I said so at the time.
The old app tests the new one
The MATLAB app is still in this repository. It does more than sit there. The engine behind the web version is checked against a line-by-line port of it, and on the old settings the two have to agree to about one part in a billion. If I break something in the year loop, the 2014 code is what tells me.
What the web version added
It runs every case since 1871 rather than 81, and each window uses the inflation that actually happened in those years instead of one rate you assume. Federal and state tax come from the published tables, so nobody has to guess at a rate. It knows the 2026 contribution limits, the penalty on money drawn before 59 and a half, the rule of 55 that waives that penalty on a 401K, and required minimum distributions. It also runs Monte Carlo, which the old app never did.
There is still a list of things it does not model: healthcare costs, long-term care, the Social Security earnings test, yearly dividend tax in a taxable account, Roth conversions, 72(t) payments, state deductions and partial retirement exclusions. Any of those can matter more to your plan than the things I did model.
I am not a finance professional. I built this for myself first, everything it shows you is a projection from historical data, and you should ask a fiduciary before you do anything drastic with your money.
If a number looks wrong
Write to support@retire-plan.app and tell me what you were looking at. I have checked the model against its sources and against the old app, and I have still missed things before. I asked for corrections on that first post in 2014 and I am still asking.